Reports
Operational reports plus the registers that reconcile — daily close, invoices, payments, A/R, tax, credit, discounts and parts GP.
The Reports page has two halves, and the difference between them matters.
Operational reports answer "how are we doing" — average repair order, labour performance, inspection conversion, retention, campaign attribution. Registers answer "does this reconcile" — they read your posted invoices and the payment ledger, and they will tell you plainly whether a day closes.
Action Center
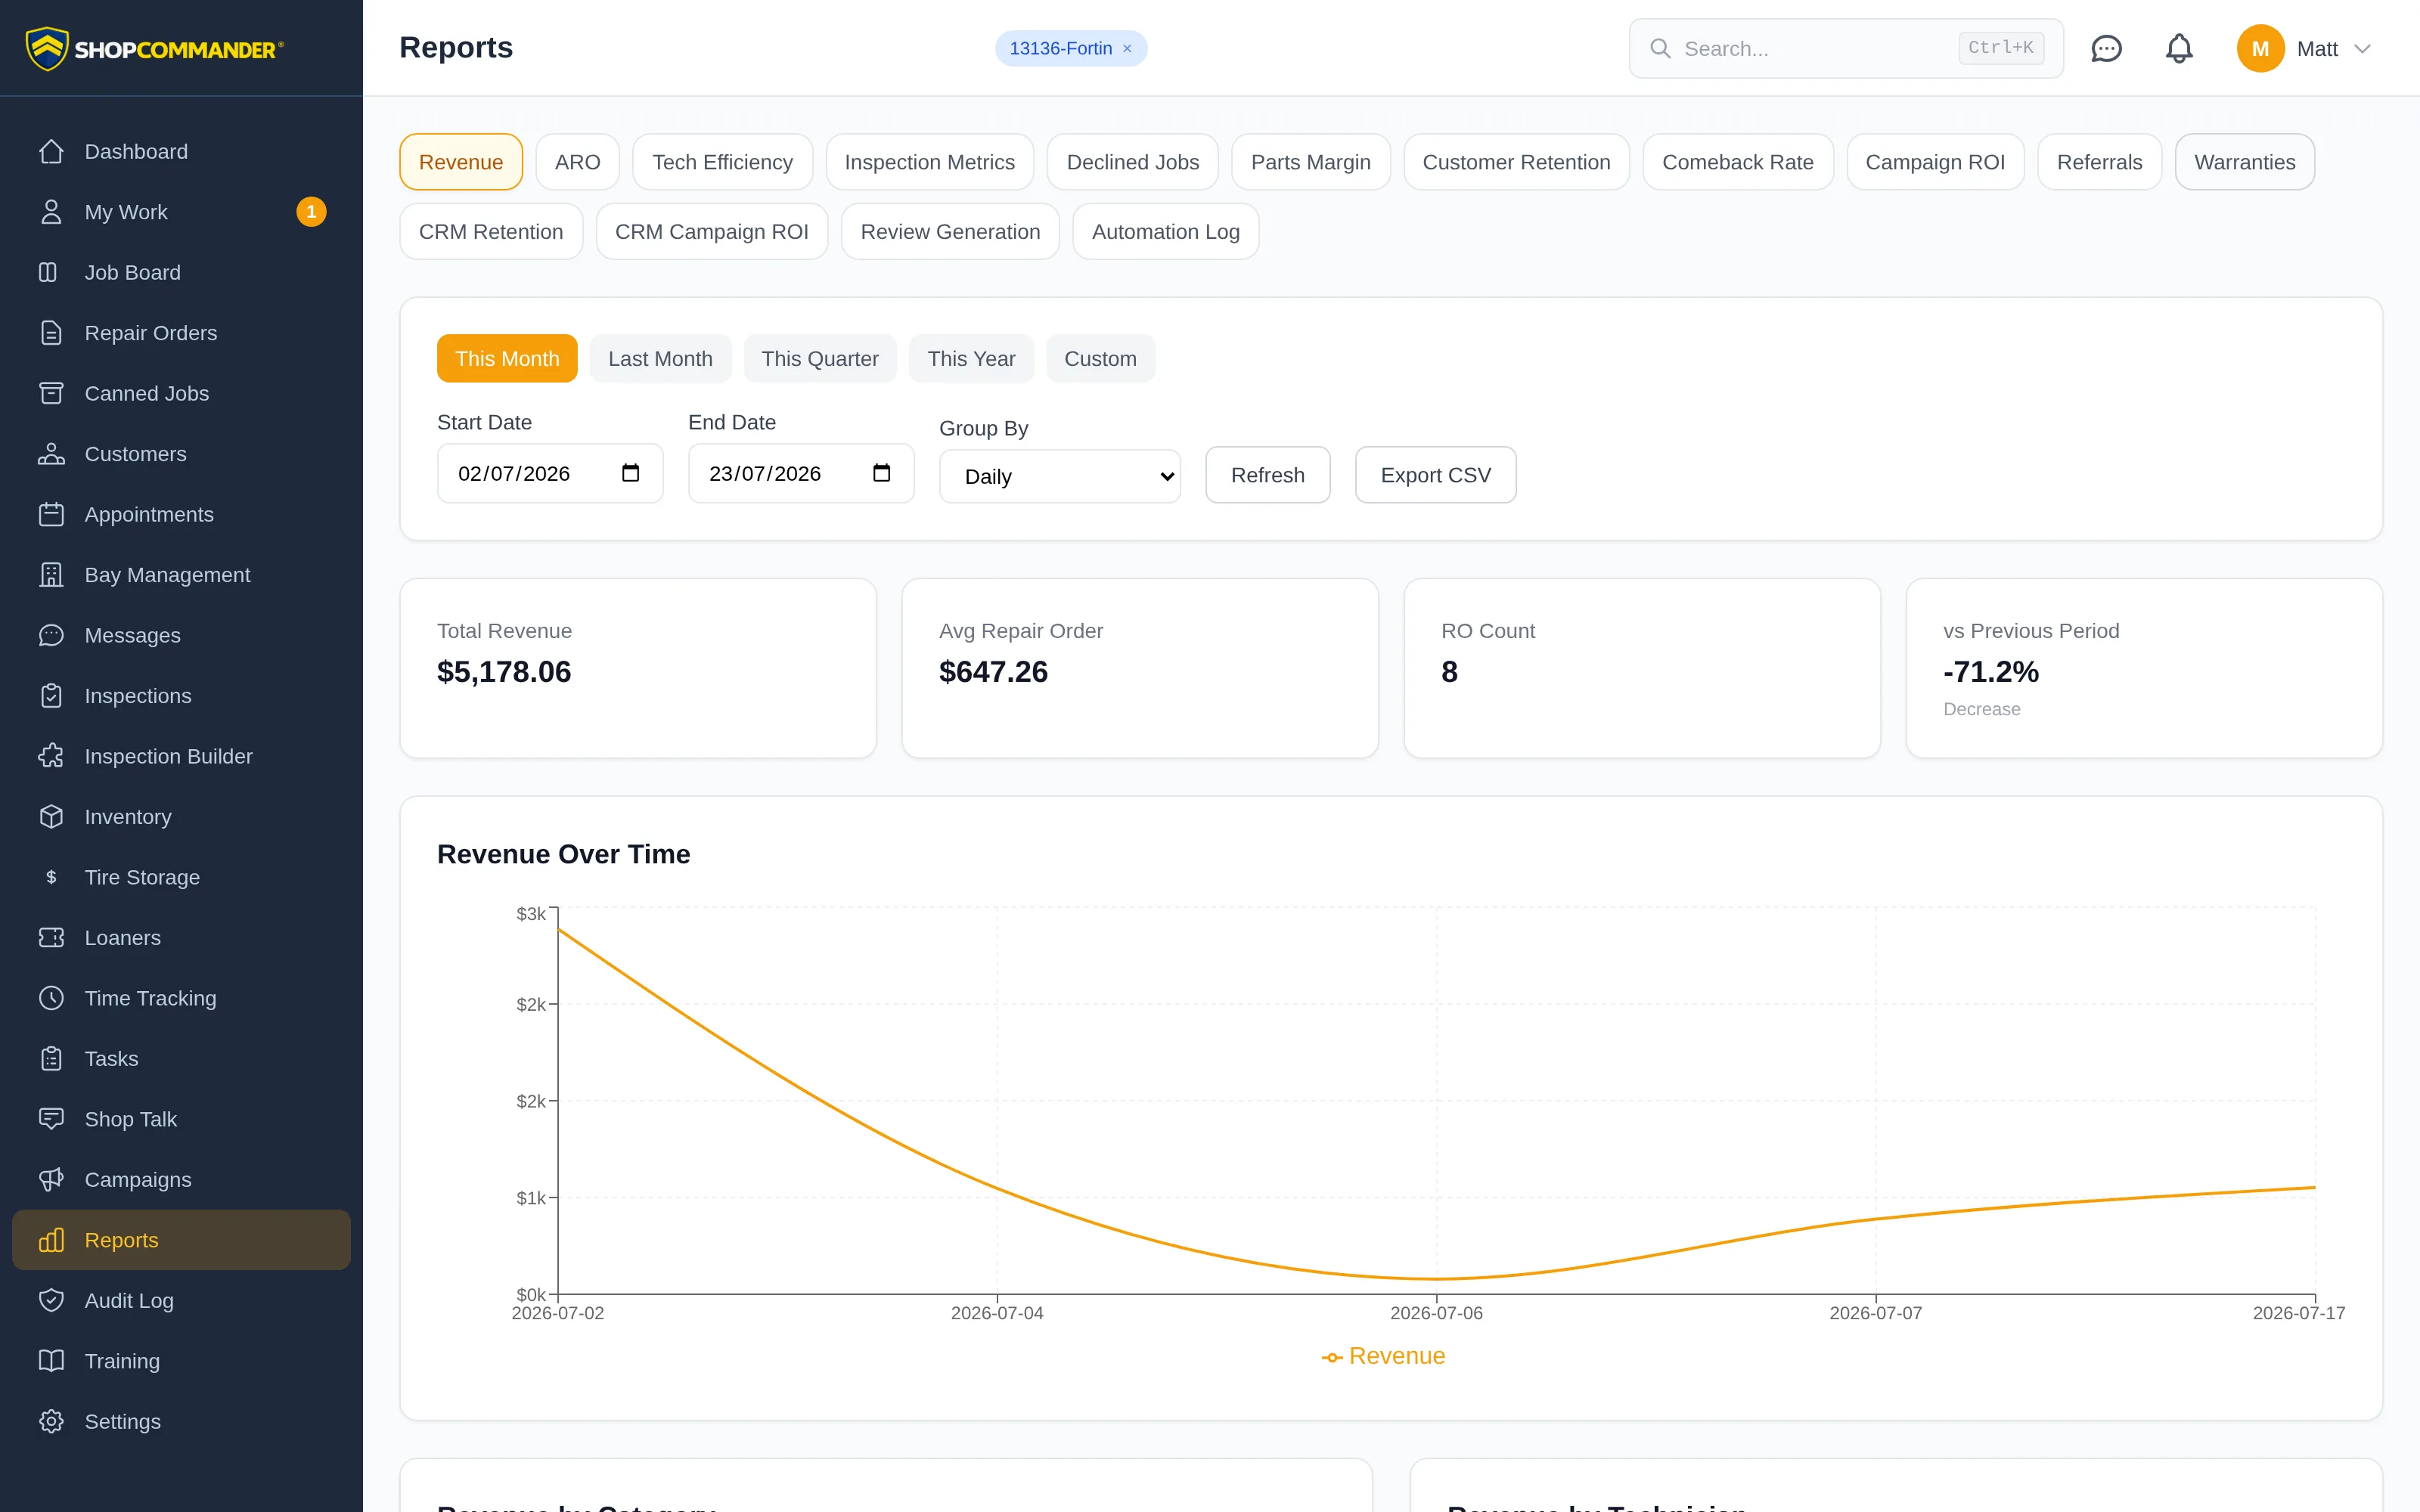
Action Center is the management exception workspace at /reports/action-center. It groups current decision domains, explains consequence/ownership, and links to the exact source record. Resolve the underlying appointment, repair order, inventory, task, custody, business-office, or provider state; Action Center does not erase source evidence merely to empty a queue.
Browse by area narrows the queue; search matches an issue, source or owner, and Priority narrows it further. The critical count opens the critical queue. Items stay ordered by priority, then oldest first. Use Clear filters to return to all items and Show more to continue through the queue. More contains Save view, Export CSV (with export permission), and favourites. The stated cutoff and historical-snapshot warning remain visible; corrections still happen on the source record.
Picking a date range
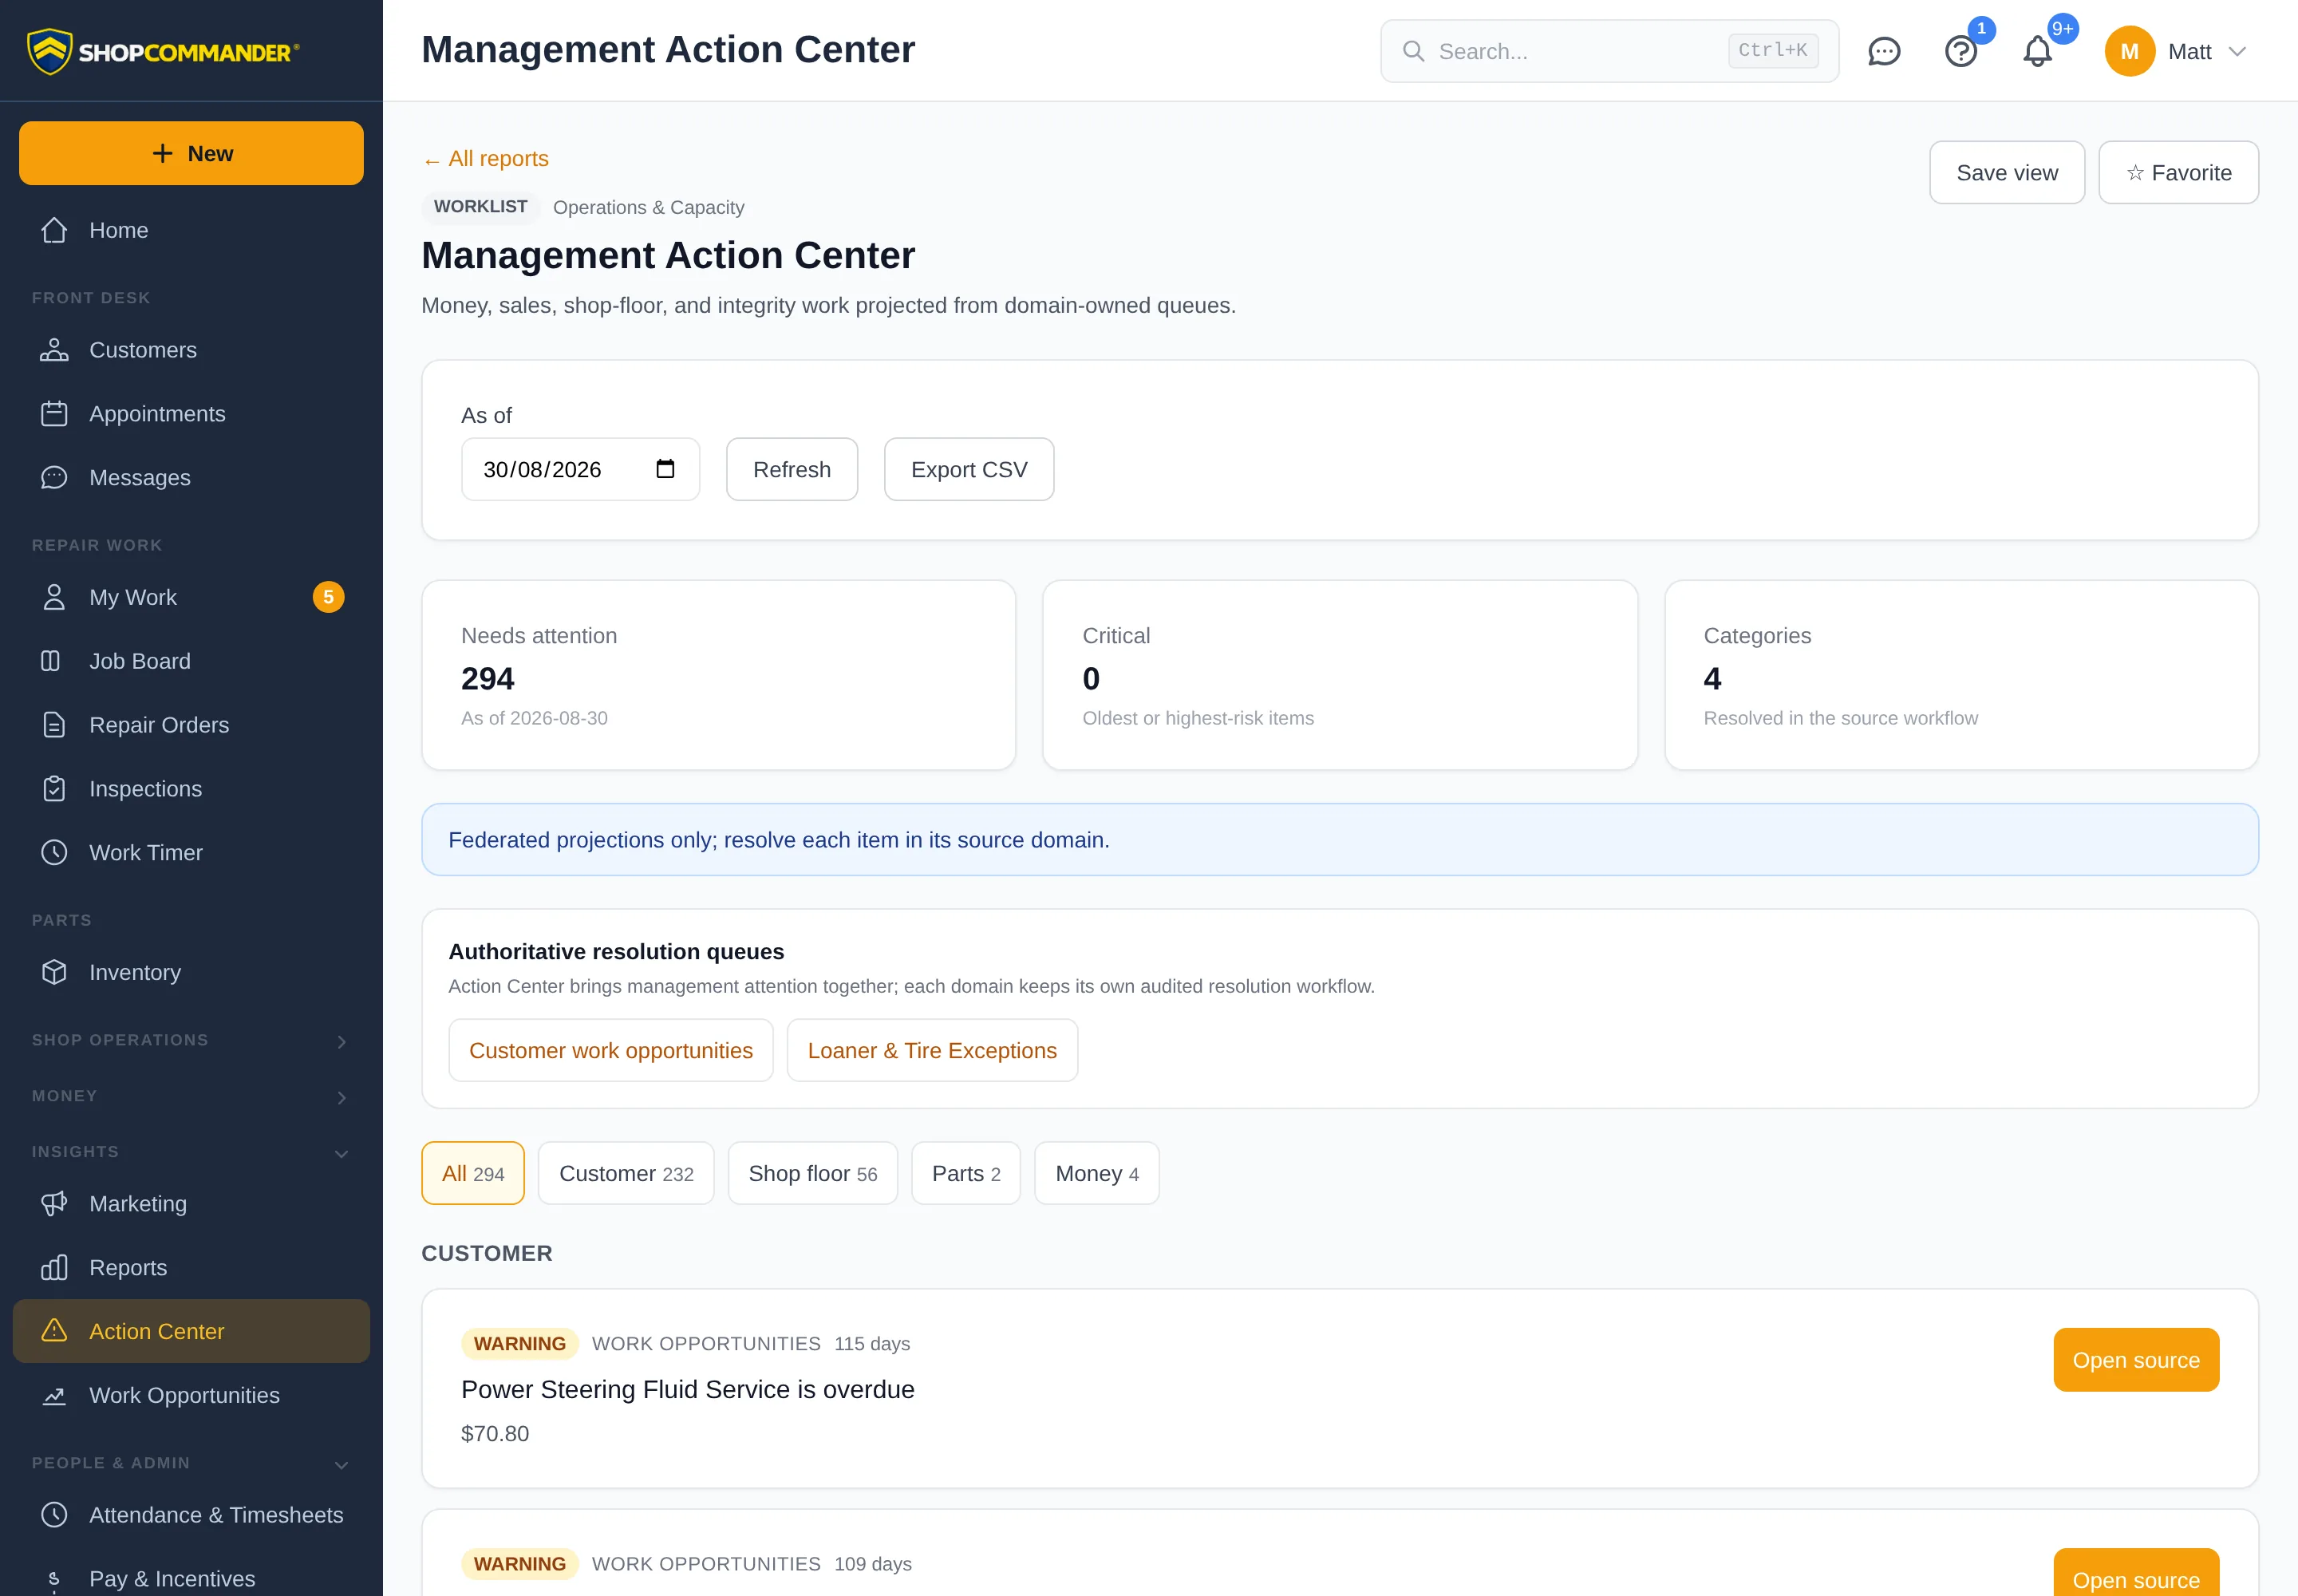
Date-based reports use a shared range; Daily Close uses one business date and aging reports use their stated cutoff. Use the presets — This Month, Last Month, This Quarter, This Year — or choose Custom and set your own start and end dates. Sales Summary and Average Repair Order also let you switch granularity between daily, weekly and monthly.
Date ranges follow your shop's calendar. Review the scope shown above the results when comparing reports.
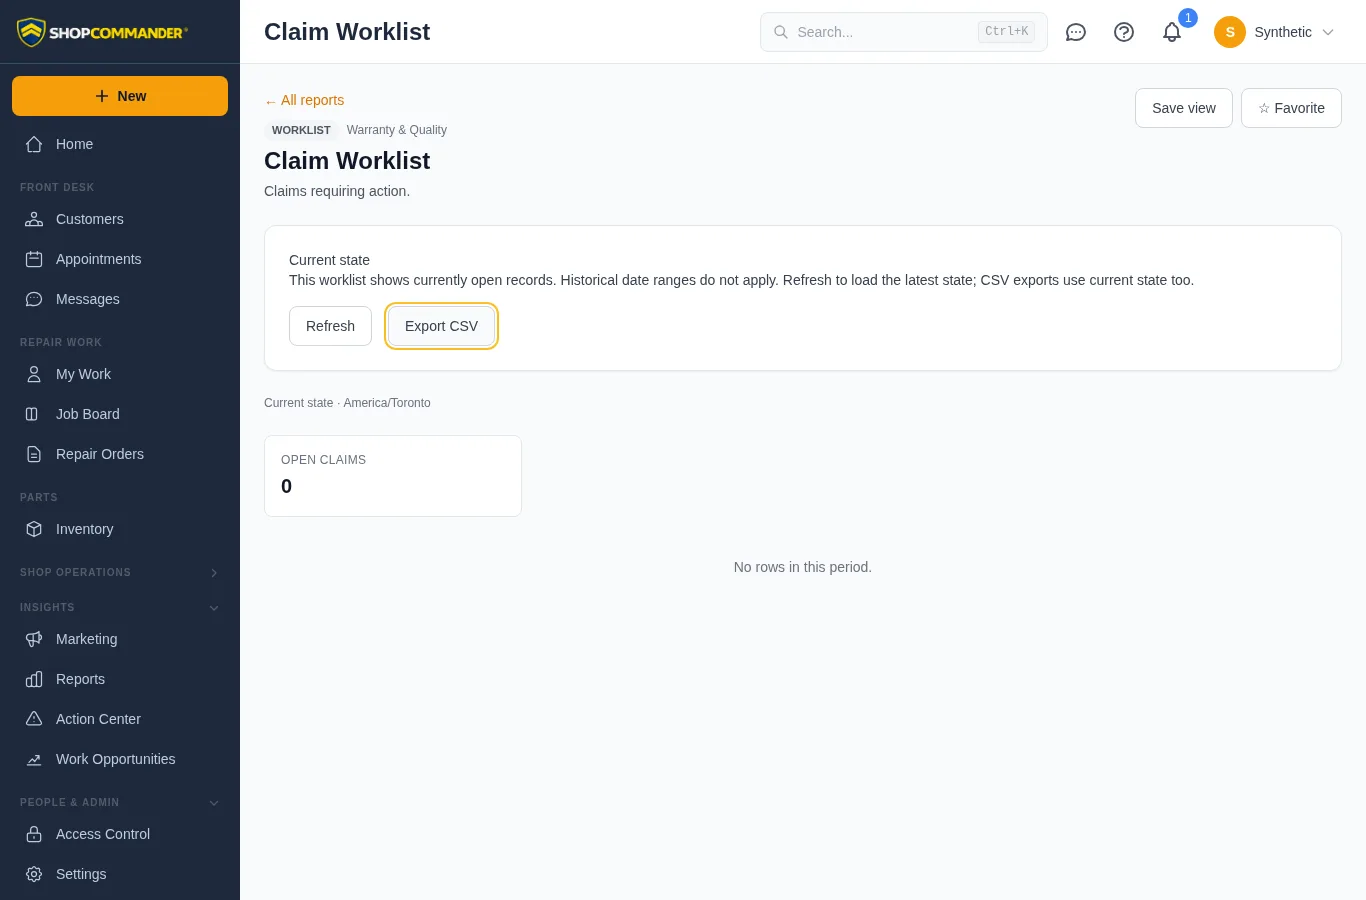
Claim Worklist, Return Visits, and Warranty Receivables show Current state: open records and outstanding balances at the time they load. They have no historical date controls. Refresh loads current data again, and CSV exports identify their current scope and shop date. Saved views retain the worklist selection, not a historical snapshot.
Money reports
- Sales Summary — Net Sales as the headline, with Tax Charged and Gross Invoiced beside it so the three always add up. Category and technician tables are pre-tax and sum to Net Sales exactly.
- Average Repair Order — average net sales per posted document, by business date. Independent of whether the invoice has been paid.
- Parts Sales, COGS & GP — parts sold, what those parts cost when they were sold, and the difference. Cost is frozen at the moment of sale, so editing a part's cost today never rewrites last month's margin.
- Parts Pricing & Markup — markup offered and how often customers accepted it. A pricing question, deliberately kept apart from the margin figures above.
Shop floor reports
- Labor Performance — hours sold, hours worked and hours available, reported separately. A ratio is withheld rather than guessed when its denominator is missing.
- Inspection Funnel — one inspection cohort followed through recommendation, conversion, customer decision, billing and payment.
- Warranty Coverage & Claims — active coverage as of today, and claims filed within the period.
Customer and marketing reports
- Declined & Deferred Recovery — estimated pipeline from declined work, and separately the sales actually earned when that work came back. A recovery names the line it returned as.
- Visit & Retention Cohorts — return rate over customers whose return window has closed, so a recent visit is not counted as a failure to return.
- Conversion & Attributed Sales — sends, responses and the net sales attributed to each campaign within its window.
- Referrals and Review Conversion — where new customers come from, and how many review requests turned into reviews.
Registers and close
These read posted documents and the signed payment ledger. They are the figures to reconcile against.
- Daily Close — sales, tax, tender, credit movement and closing A/R for a day, with each reconciliation equation shown and a plain verdict on whether the day can be signed off.
- Invoice Register and Payment Register — every document earned and every settlement event, with totals.
- A/R Aging — who owes what, since when, as of a date.
- Tax Liability — tax charged per rate for a filing period, from the frozen components on each document.
- Credit Liability — store credit opening, granted, used and closing.
- Discounts & No-Charge — what was discounted, what was given away and what fees were charged.
- Parts GP Register — parts sales and frozen cost line by line, with each line's cost quality shown.
- Exception Queue — anything that cannot be reconciled, split into what is repairable and what is permanent history.
Daily Close keeps Persist sign-off visible when blocked and explains the reconciliation, exception, drawer, or permission issue that needs attention. Review the source records, correct the issue through its normal workflow, and refresh the report. The tender breakdown shows signed settlements including refunds and reversals; store credit is explicitly excluded from Gross Receipts.
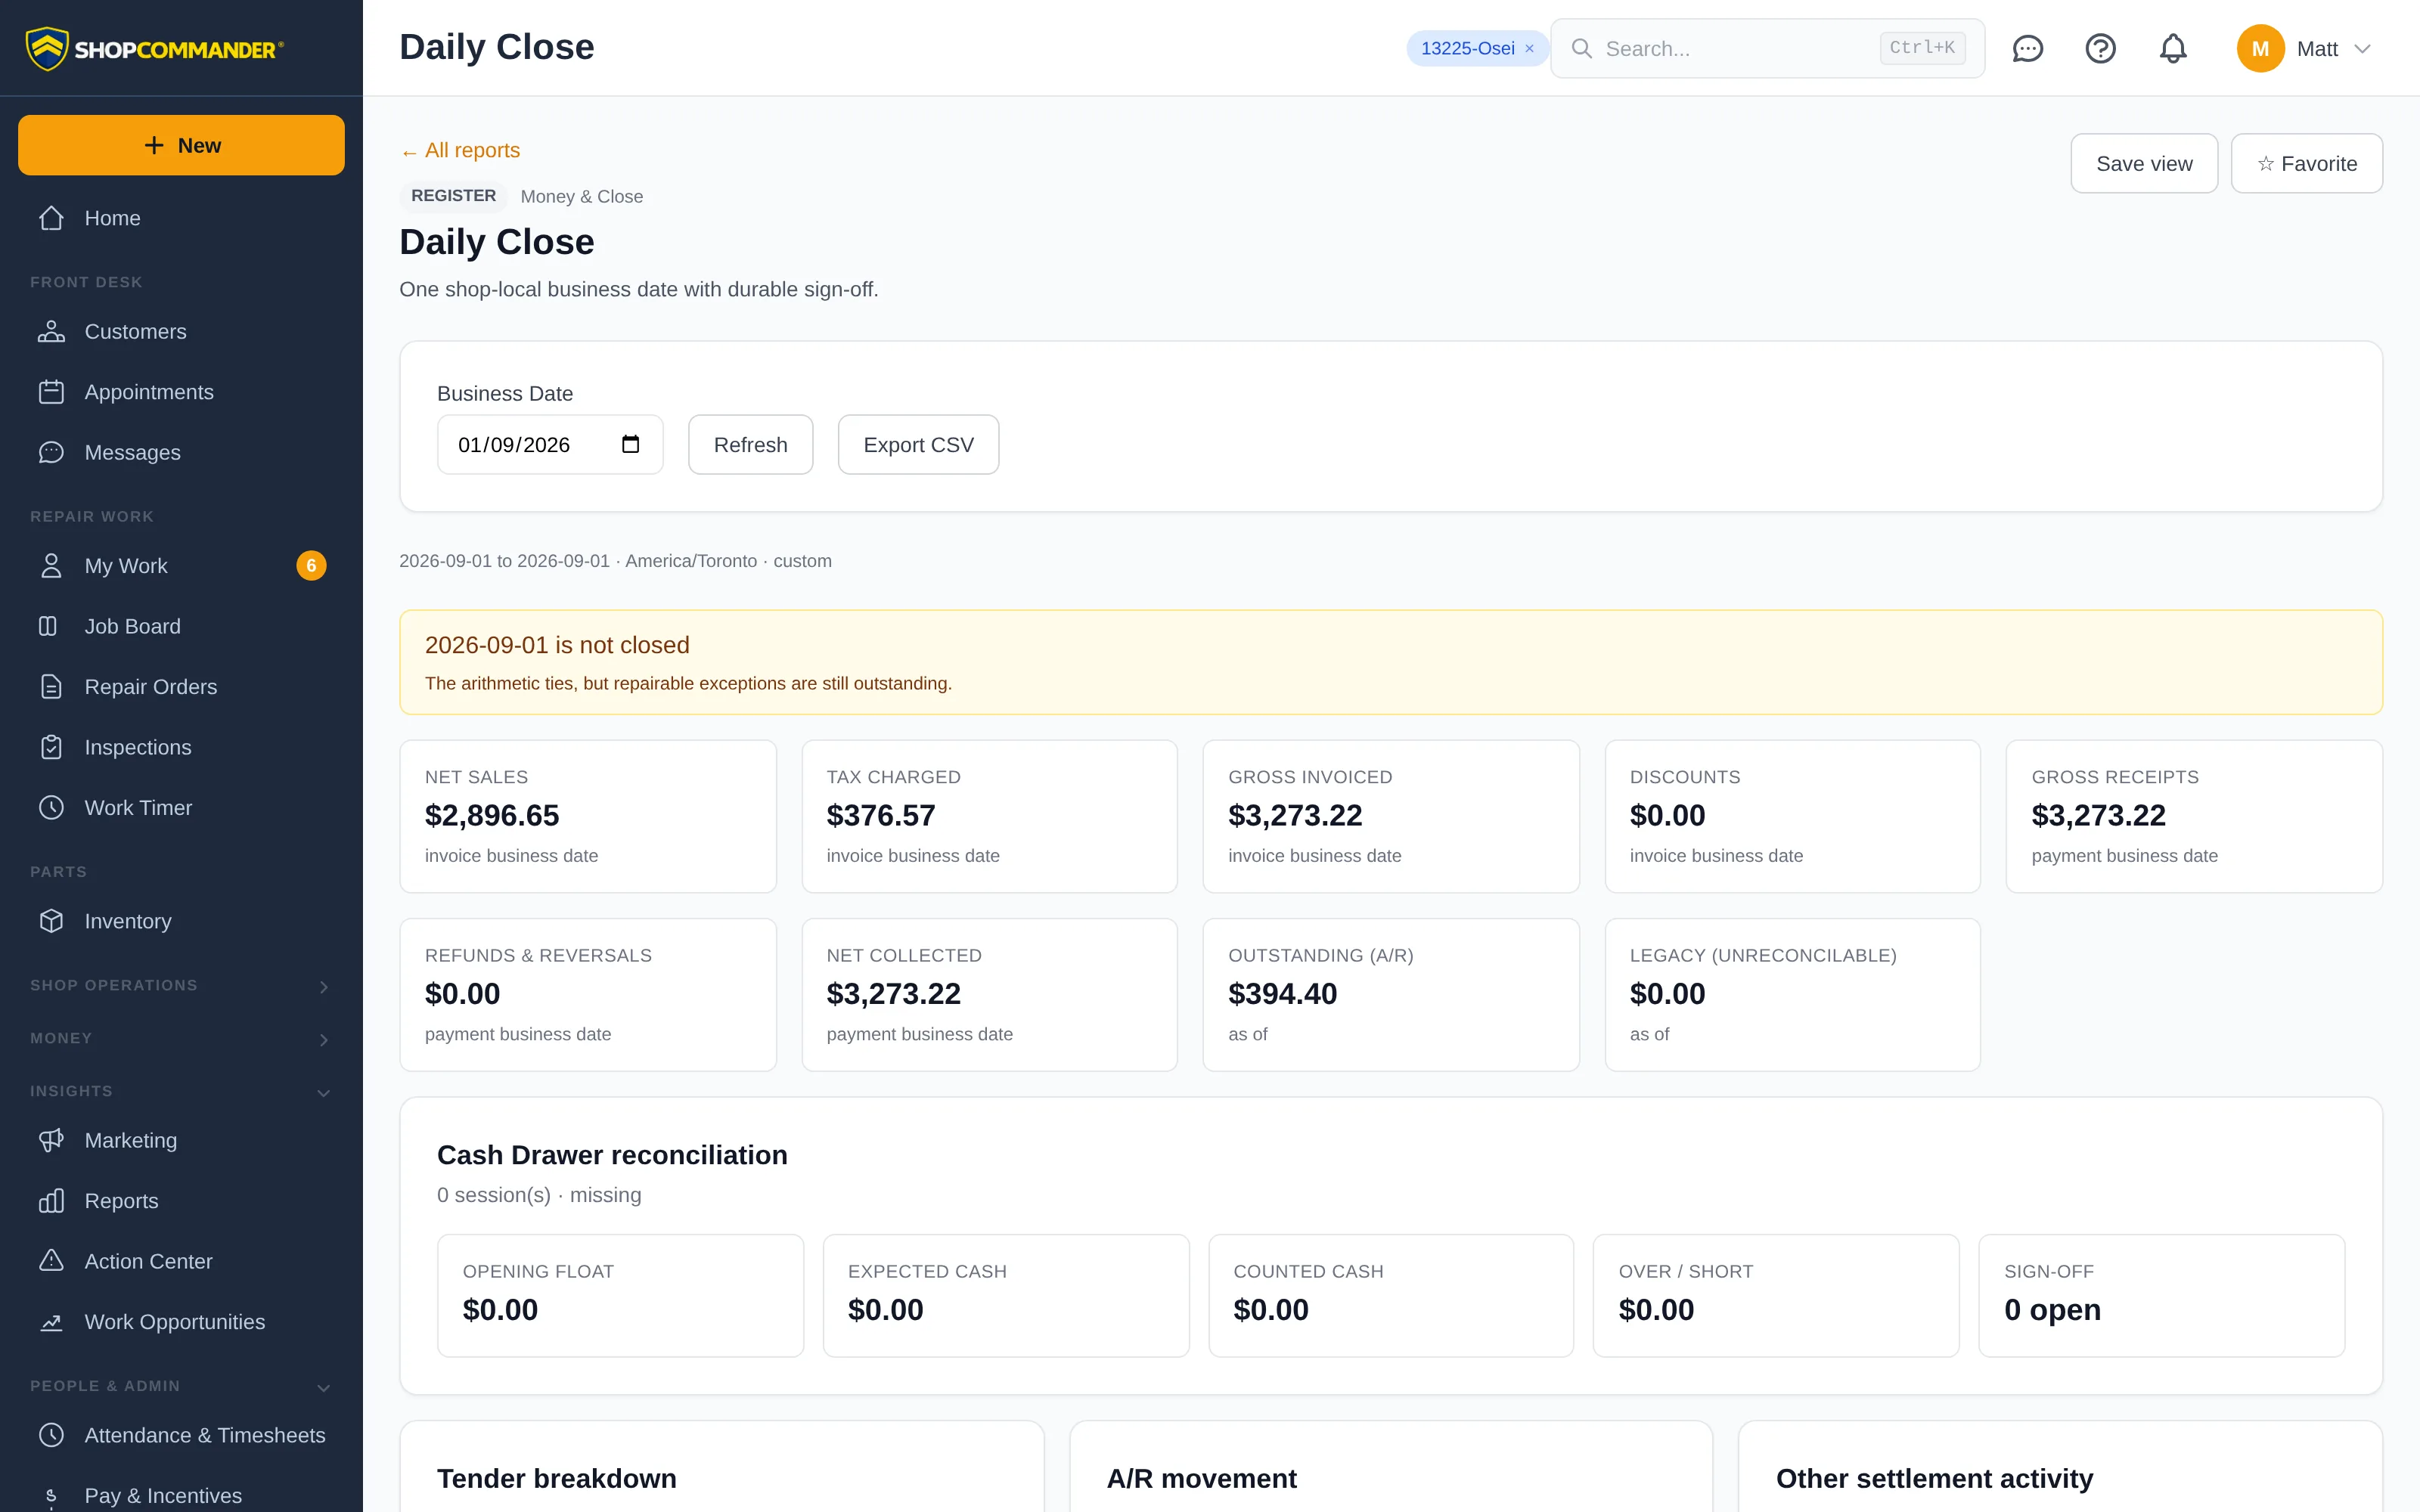
A day that balances arithmetically but still has repairable exceptions is reported as not closed. That is deliberate: a clean total over rows nobody could reconcile is exactly the kind of "balanced" worth distrusting.
Drilling into a number
Where a report headline has a reconciled definition, View source rows opens the exact documents or events behind it, and Export CSV downloads those same rows. The file is the evidence for the figure, not a different slice of it.
A habit worth building
Run Daily Close on yesterday every morning. It takes a minute, it tells you whether the day tied, and it names anything that needs fixing while the day is still fresh in someone's memory.
Compare sales with invoice averages
Net Sales includes posted invoices and credit notes. Average Invoice uses invoice sales divided by invoice count and excludes credit notes. The invoice count is labelled Invoices. Because these populations differ, dividing Net Sales by Invoices does not necessarily reproduce Average Invoice.
Parts contribution reconciliation
Parts Contribution, its source register, and Known Contribution use the same posted invoice and credit-note population. Net parts sales include the allocated share of discounts. A price credit inherits the original sale’s cost coverage; unknown original costs remain unknown. Zero-sale lines with frozen parts cost still contribute that expense. No invoice, stock movement, or historical cost is rewritten when these reports run.